Institutional Assessment
Demographics
Table 1.1 Student Demographics
WASC Annual Report Year 2022
12-month Undergraduates Enrollment (Not including LOA Students) – 2022 (Fall Term Full-Time Equivalent (FTE) Undergraduates Enrollment)
Ethnicity | Men | Women | Total |
White, non-Hispanic | 27 | 6 | 33 |
Black, non-Hispanic | 2 | 5 | 8 |
Hispanic | 2 | 1 | 3 |
Asian | 41 | 59 | 100 |
Native Hawaiian or Pacific Islander | 0 | 0 | 0 |
American Indian or Alaskan Native | 0 | 0 | 0 |
Two or more races | 0 | 0 | 0 |
Race/ethnicity unknown | 0 | 0 | 0 |
Non-resident Alien | 0 | 0 | 0 |
Total | 72 | 71 | 143 |
12-month Graduates Enrollment (Not including LOA Students) – 2022 (Fall Term Full-Time Equivalent (FTE) Graduates Enrollment)
Ethnicity | Men | Women | Total |
White, non-Hispanic | 18 | 12 | 30 |
Black, non-Hispanic | 3 | 1 | 4 |
Hispanic | 1 | 1 | 2 |
Asian | 30 | 47 | 77 |
Native Hawaiian or Pacific Islander | 0 | 0 | 0 |
American Indian or Alaskan Native | 0 | 0 | 0 |
Two or more races | 0 | 0 | 0 |
Race/ethnicity unknown | 0 | 0 | 0 |
Non-resident Alien | 0 | 0 | 0 |
Total | 52 | 61 | 113 |
The data represents the 12-month Undergraduates Enrollment for the 2022 fall term full-time equivalent (FTE) Undergraduates Enrollment at Stanton University. The data is organized by ethnicity and gender, showing the number of male and female students in each category.
Stanton University has a total of 143 full-time equivalent undergraduates, with the same number of female students (71) compared to male students (72). When analyzing the racial and ethnic makeup of the student body, it is evident that the majority of students are either white, non-Hispanic or Asian.
As for graduate full-time enrollment in fall of 2022 the data represents the 12-month graduate student enrollment for the fall term of 2022 at Stanton University. The total number of graduate students enrolled at the university is 113, with a slightly higher number of women (61) than men (52). Overall, the data provides a snapshot of the graduate student population at Stanton University in the fall of 2022. It is important to note that while this data provides a valuable starting point, further analysis would be necessary to gain a deeper understanding of the enrollment trends and demographics at the university.
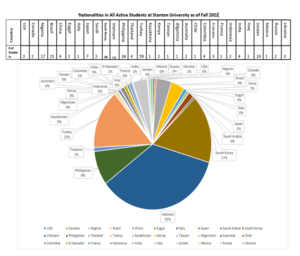
Table 1.2 Student Nationalities as of Fall 2022